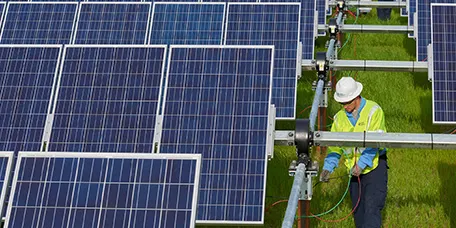
This year alone, the utility-scale sector is projected to install more than twice as much new capacity as it ever has previously in a single year, noted authors Mark Bollinger and Joachim Seel.

In 2015, developers brought into commercial operation 83 ground-mounted PV projects totaling 2.825MW (ac), raising the nationwide total to 278 projects with 9.016GW nameplate capacity.

The 30% investment tax credit (ITC) will continue at full value until the end of 2019 before phasing down to 10% in 2022 for commercial projects on a permanent basis. It will no longer apply for residential PV.

The ITC extension last December also included a favorable switch to a “start construction” eligibility requirement rather than “placed in service.”

Prices for utility-scale PV systems that came online in 2015 fell by $0.30/W (12%) from the prior year. Preliminary data for the first six months of 2016 suggest that prices have continued to fall within most states and market segments.

Among the installation trends noted in Utility-Scale Solar 2015 were expansion of use of solar tracking devices (overwhelmingly single-axis, east-west tracking), particularly among thin-film projects, which which had almost exclusively opted for fixed-tilt mounts prior to 2014.

In a reflection of the ongoing geographic expansion of the market beyond the sun-drenched Southwest, the average long-term insolation level across newly built project sites declined for the first time in 2015.

PV project performance – as measured in terms of capacity factor – has improved among more recently built projects, driven by advances in both technology and project design. As noted, the growing number of projects deploying tracing technology is boosting performance.

In addition, developers have been augmenting the size of projects’ solar arrays relative to their inverters (resulting in higher inverter loading ratios, or ILRs), as another way to boost output, according to the report.

Projects have, on average, been increasingly built at sites with stronger solar resources.  

In a sample of 170 PV projects totaling 5.907GW (ac) nationwide, cumulative net AC capacity factors ranged from 15.1% to 35.7%, with a sample mean of 25.7%. .

Driven by lower installed project prices and improving capacity factors, levelized PPA prices for utility-scale PV have fallen dramatically over time, by $20-$30/MWh per year on average from 2006 through 2013, with a smaller price decline of about $10/MWh per year evident in the 2014 and 2015 sampled by Berkeley Lab.

Most PPAs in the 2015 sample—including many outside of California and the Southwest—are priced at or below $50/MWh levelized (in real 2015 dollars), with a few priced as aggressively as ~$30/MWh.

“Falling PPA prices have enabled the utility-scale market to expand beyond the traditional strongholds of California and the Southwest into up-and-coming regions like Texas, the Southeast, and even the Midwest,” said Bollinger.

There are currently no concentrating solar power (CSP) projects moving towards construction in the US, after 1.237GW came online in the last three years. The country now has seven CSP projects in operation larger than 5MW (ac) totaling 1.381MW (ac).

Five utilize parabolic trough technology (one of which has 6 hours of molten salt thermal storage capabilities), while the two feature power tower technology.

“CSP prices do not seem to have declined over time, which stands in stark contrast to the median PV prices included in the figure. Of course, the CSP sample is small, and features several different technologies and storage capabilities, which complicates comparisons,” the authors note in the report.


.